I have recently attended and presented at Swissquote Conference on Machine Learning in Finance. With over 250 participants, the event was a great success to hear from the industry leaders and to see the recent developments in the field.
The conference featured very interesting talks ranging from an application of natural language processing (NLP) for industry classifications to a systematic trading in structured products using deep learning. For the interested, the slides and videos are available on the conference page.
I would like to share and introduce my talk presented at the conference on applications of machine learning for quantitative strategies (the video of my talk available here).
In my talk, I address the limitations of applying machine learning (ML) methods for quantitative trading given limited sample sizes of financial data. I illustrate the concept of probably approximately correct (PAC) learning that serves as a foundation to the complexity analysis of machine learning.
In particular, the PAC learning establishes model-free bounds on the sample size to estimate a parametric function from the sample data for a specified level of approximation and estimation error. I recommend very nice textbooks An Elementary Introduction to Statistical Learning Theory and The Nature Of Statistical Learning Theory to study more about the PAC learning.
I also present an example of using supervised learning for the selection of volatility models for systematic trading from my earlier presentation.
Finally, I touch on the important topic of the risk-profile of quantitative investment strategies and, in particular, Alternative Risk Premia (ARP) products. For the past few years, since about 2015, the sell-side have been marketing a plethora of ARP products as “cheap” substitutes for hedge fund strategies. However, ARP products fared miserably throughout year 2018 despite the fact that most of these products were marketed as market-neutral. I wanted to share my view why ARP products failed…
The typical creation process of ARP products is as follows. First, a research team runs multiple back-tests of “academic” risk factors (value, carry, momentum, etc) across many markets until a specific parametrization of their strategy produces a satisfactory Sharpe ratio (around 1.0 or so). Once the necessary performance target is achieved in the back-test, the research team along with a marketing team would write a research paper with economic justification of the strategy. Then the marketing team would pitch the strategy to institutional clients. If the marketing team is successful, they would raise money for the strategy. Finally, the successful strategy (out of dozens of attempted) would reach to the execution team who would implement the strategy in a trading system and execute on behalf of clients.
The creation of ARP products serve as a prime example why we need to understand the limitations of statistical learning given limited sample sizes of financial data. Also, there is the incentive to fit a rich model to the limited sample to optimize the in-sample performance. For an example, using PAC learning, to estimate a model with 10 parameters at an approximation error within 10% we need to apply 2,500 daily observations!
It is no coincidence that ARP product suffered a major blow once market conditions changed. As we speak, post October 2018, quants are facing a crisis of confidence.
In the hindsight, year 2018 brought to the failure the two very popular strategies:
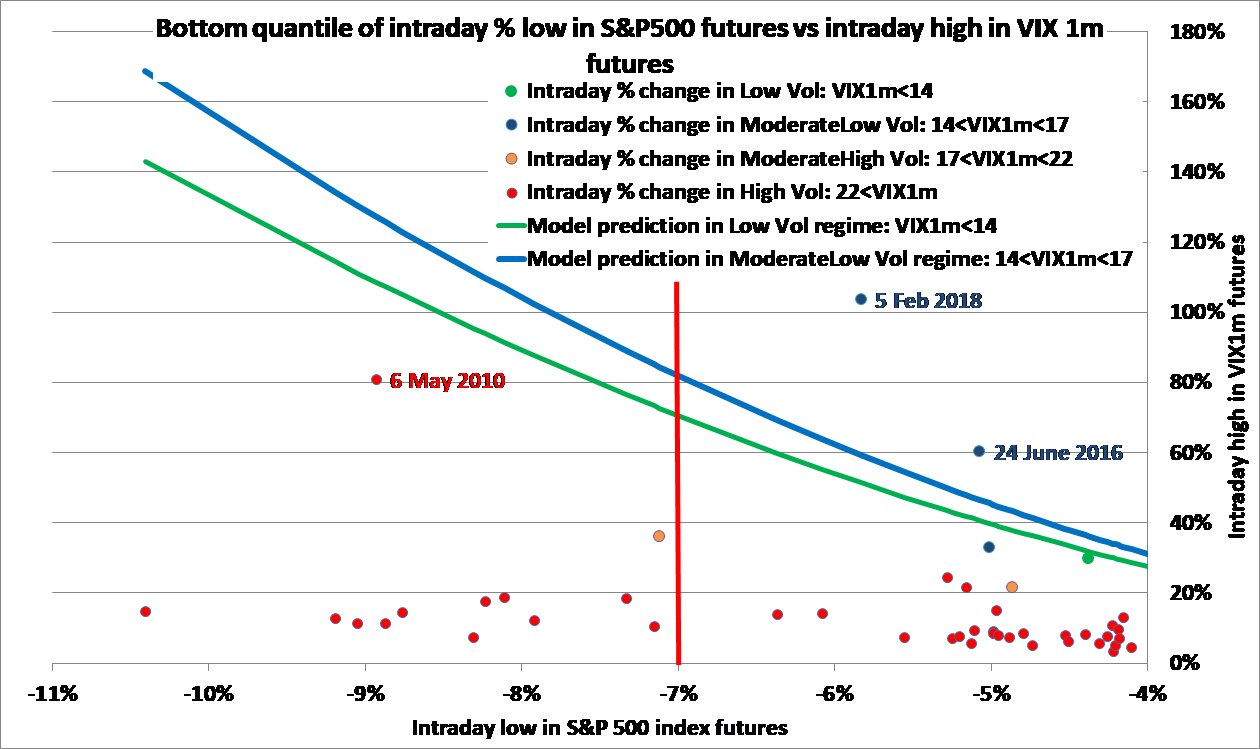
1) The short volatility ETNs: the figure at the top of the post illustrates how would a naive 5-parameter regression fit the in-sample data of past two years with the accuracy of 98%, but the fitted model fails miserably in February 2018 (I posted a detailed statistical analysis of the crash).
2) The alternative risk-premia products: the figure below shows the risk-profile of Bank Systematic Risk Premia Multi-Asset Index compiled by the Hedge Fund Research.
In the figure below, as the predictor, I use the quarterly returns on the S&P 500 index which I condition into the three regimes: bear (16% of the sample), normal (68%), and bull (16%). Then I consider the quarterly returns on the HFR index conditional on these regimes and illustrate the corresponding regression of returns on the HFR index predicted by returns on the S&P 500 index.
It is clear that the HFR index sells 3 puts to buy 5 calls to obtain the leveraged exposure to the S&P 500 index. Well, over the past decade these models learned to leverage the upside at the cost of selling the downside.

The key message from my talk is that, we may be able to avoid the traps of applying machine and statistical learning methods for systematic trading strategies by understanding the theoretical grounds of the ML methods and the potential limitations of using only limited sample sizes for the estimation of these models.
Disclaimer
All statements in this presentation are the author personal views. The information and opinions contained herein have been compiled or arrived at in good faith based upon information obtained from sources believed to be reliable. However, such information has not been independently verified and no guarantee, representation or warranty, express or implied, is made as to its accuracy, completeness or correctness. Investments in Alternative Investment Strategies are suitable only for sophisticated investors who fully understand and are willing to assume the risks involved. Alternative Investments by their nature involve a substantial degree of risk and performance may be volatile.


 Importantly, the valuation of options on these assets is not feasible using conventional stochastic volatility models applied in practice such as Heston, SABR, Exponential Ornstein-Uhlenbeck stochastic volatility models, because these models fail to be arbitrage-free (forwards and call prices are not martingals). Curiously enough, the topic of no-arbitrage for SV models with positive return-volatility correlation has not received attention in literature, despite a large number of assets with positive return-volatility correlation.