Artur Sepp Blog on Quantitative Investment Strategies

  • Blog
  • Research
  • About
  • Category: Asset Allocation

    • The Science and Practice of Trend-following Systems: paper and presentation

      Posted at 5:35 pm by artursepp, on June 22, 2025

      I would like to introduce the updated draft of my paper co-authored with Vladimir Lucic and entitled “The Science and Practice of Trend-following Systems”.

      Trend-following systems have been employed by many quantitative and discretionary funds, also known as commodity trading advisors (CTAs), or managed futures, since the early 1980s. Richard Dennis, a commodity trader on the CME, organised and instructed two classes of novice traders in late 1983 and 1984 with the idea that trading skills can be taught. The underlying ideas and methods included strict adherence to rule-based trading and risk-management. A few graduates of these classes created their own quantitatively-driven CTA funds and gave the rise of managed futures industry.

      Lintner in 1983 provided the first evidence that managed futures deliver better risk-adjusted returns and offer strong diversification benefits for long-only portfolios. The following passage is from Lintner 1983, The Potential Role of Managed Commodity-Financial Futures Accounts (and/or Funds) in Portfolios of Stocks and Bonds:
      “The combined portfolios of stocks (or stocks and bonds) after including judicious investments in appropriately selected sub-portfolios of investments in managed futures accounts (or funds) show substantially less risk at every possible level of expected return than portfolios of stock (or stocks and bonds) alone. This is the essence of the ‘potential role’ of managed futures accounts (or funds) as a supplement to stock and bond portfolios suggested in the title of this paper.”

      Subsequent studies reinforce the role of managed futures for the diversification of broad long-only portfolios, so that currently many private and institutional portfolios have some exposure to managed futures.

      The purpose of this paper is to provide both theoretical and practical insights about trend-following (TF) systems. Let me note that practitioners refer to implemented systematic futures-based strategies as systems or programs.

      Theoretical insights

      For theoretical insights, we establish regimes in which TF systems perform well. For any systematic strategy, it is important to understand under which market dynamics it is expected to out-perform or under-perform.  We derive an exact analytical formula linking the performance of the TF system to the autocorrelation of instrument returns under generic processes. We show that the TF system is expected to be profitable when the autocorrelation of returns is positive even if the drift is zero. We also show that the TF system is expected to be profitable for a white noise process with a large positive or negative drift if the filter span is large.

      For the illustration of obtained analytical results, we focus on fractional ARFIMA process which incorporates both short- and long-term mean reversion and / or trend features, which allows for extensive profitability analysis of TF systems.

      In Figure 1, we illustrate that the TF system can be profitable if the fractional order is positive, so the dynamics are trending in the long-term. In this case, the TF system can be profitable even if the short-term dynamics are mean-reverting.

      Figure 1. Panel (A) shows analytical value of expected annual return of TF system and MC confidence intervals using ARFIMA process with positive long-term memory with fractional order $d=0.02$, which implies long-term mean-reversion, with AR-1 feature phi={-0.05, 0.0, 0.05, and with zero drift. Panel (B) shows expected value of volatility-adjusted turnover and corresponding MC 95% confidence interval.

      In Figure 2, we illustrate that if the fractional order is negative and dynamics are mean-reverting in the long-term, the TF system can still be profitable if drift is present and span of the filter is large.

      Figure 2. Panel (A) shows analytical value of expected annual return of TF system and MC confidence intervals for ARFIMA process with negative long-term memory with fractional order d=-0.01. with AR-1 feature phi={-0.05, 0.0, 0.05} and with drift mu=0.5 (interpreted as Sharpe ratio) . Panel (B) shows expected value of volatility-adjusted turnover and corresponding MC 95% confidence interval.

      Practical Insights

      We have considered three distinct approaches for the construction of trend-following (TF) approaches which we term as European, American, and Time Series Momentum (TSMOM) systems. In Figure 3, we show the simulated performance of three TF systems assuming 2%/20% management/performance fees.

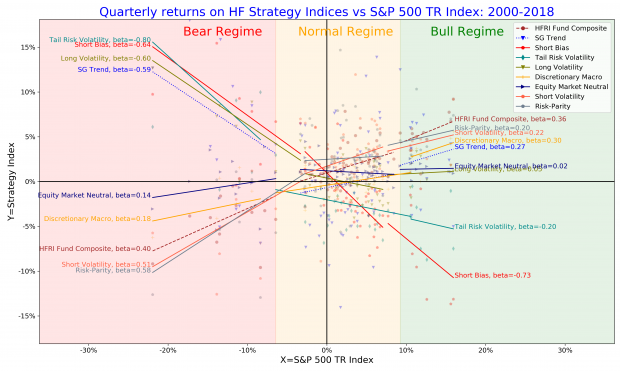
      Figure 3. Simulated performance of of European, American and TSMOM systems along with the historical performance of SG Trend Index. Panels (A1), (B1), and (C1) show the cumulative log-performance, running drawdown, and EWMA correlations with one year span. Panel (A2i) shows risk-adjusted performance table with P.a. returns being annualised return or CAGR, Vol being annualised volatility of daily log returns, Sharpe (rf=0) being Sharpe ratio, Max DD being the maximum drawdown; Skew being the skewness of quarterly log-returns, beta and R^{2} being the the slope and R^{2} of the linear regression of monthly returns relative to 60/40 equity/bond portfolio. Panel (A2ii) shows annual returns. Panels (B2) and (B3) show one year rolling volatility-adjusted turnover and cost, respectively. The background colour is obtained by ordering the quarterly returns of the benchmark 60/40 portfolio from lowest to highest and the splitting the 16% of worst returns into the “bear” regime (pink colour), 16% of best returns into the bull regime (dark green colour), and remaining regimes into “normal” regimes (light green colour). The period of performance measurement is from 31 December 1999 to 1 June 2025.

      This illustration emphasises the robustness of TF systems, as different quantitative models can provide first-order exposure to trending features of financial markets. Most CTA managers pursue to deliver outperformance over the benchmark index by second-order proprietary features including exposures to style factors (carry, value, cross-sectional momentum, etc.), risk-management (portfolio volatility targeting, asset class exposure management, etc.), operational capabilities (exposure to smaller or alternative futures markets, enhanced execution, etc.), and other risk premia (e.g. volatility carry) — see Carver 2023, Advanced Futures Trading Strategies, for a detailed overview of additional features and strategies commonly combined with managed futures.

      Smart Diversification of Long-only Portfolios

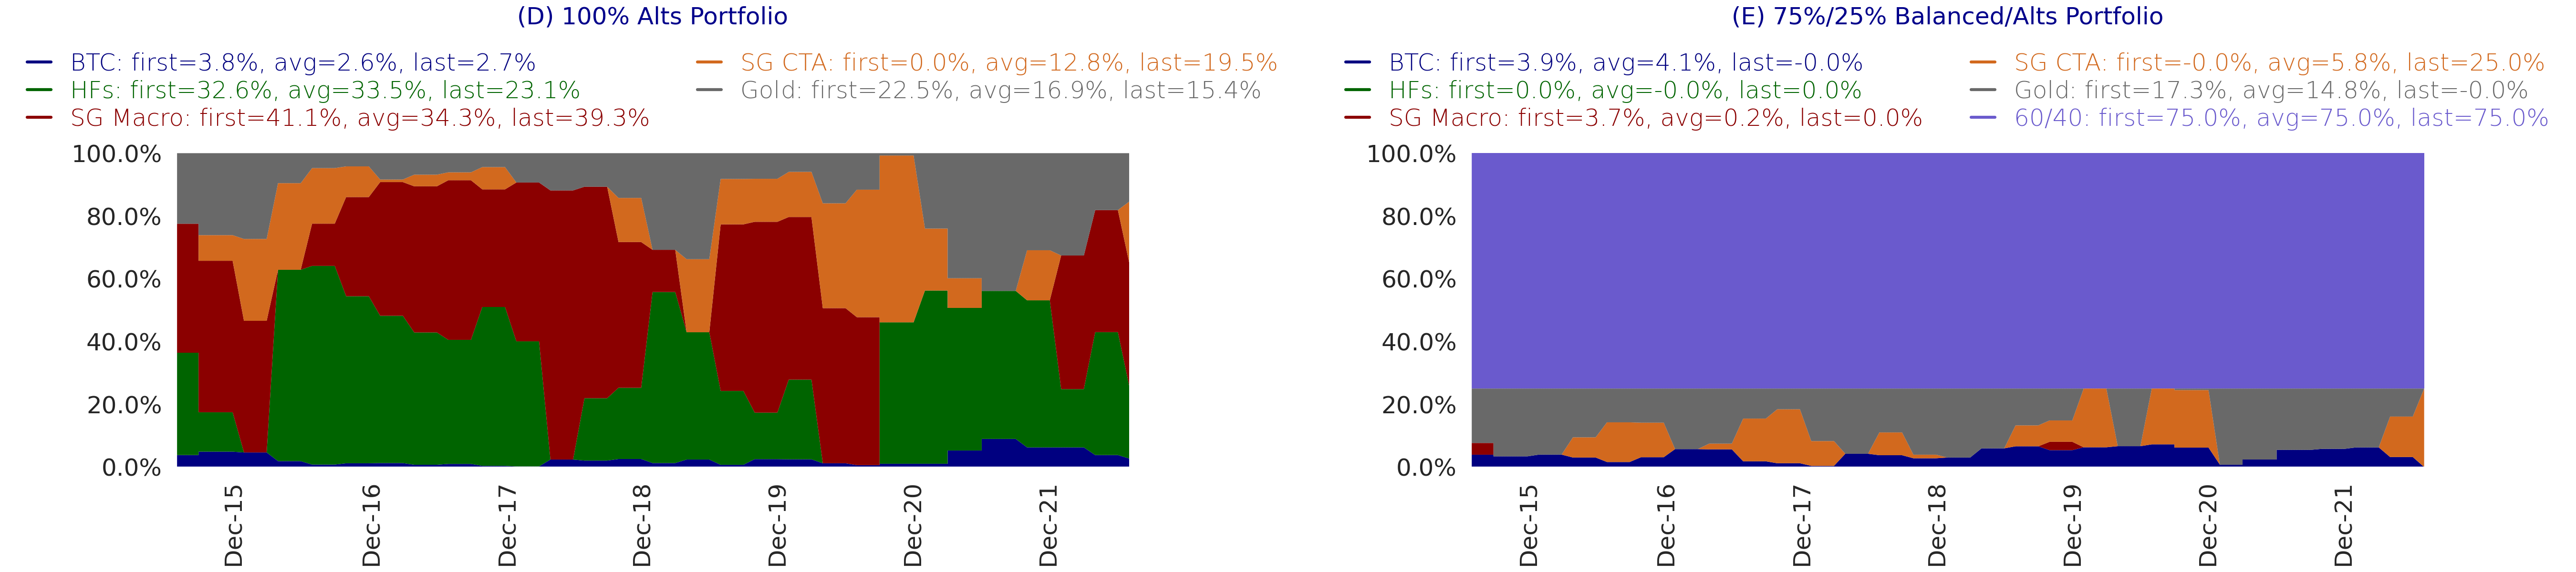
      We also analyse the diversification benefits of how blending of TF systems long-only portfolios with long-only portfolios. In Figure 4, we generate blended portfolios with (1-x)% weight to 60/40 Equity/Bond portfolio and with x% weight to each of the three TF systems with x varying from 0% to $100%. Blended portfolios are rebalanced quarterly and, for TF systems, we use their net performance. The initial portfolio on the left is 100%/0% blend of 60/40 portfolio and 0% TF system. The final portfolio on the right is 0%/100% blend. Hereby, we measure portfolio risk by the Bear-Sharpe ratio (the performance in 16% worst quarters of 60/40 equity / bond portfolio) and portfolio performance by total Sharpe ratio.

      Figure 4. Bear-Sharpe ratio vs total Sharpe ratio for blended portfolios with (1-x)% weight to 60/40 portfolio and x% weight to each of the three TF systems. The initial portfolio on the left is 100%/0%$ blend of 60/40 portfolio and 0% TF system. The final portfolio on the right is 0%/100% blend. The specification of TF systems is the same as for generation of Figure 3.

      We observe that the best combination of European and American TF systems that generates the highest Sharpe ratio is the 40%/60% combination of the 60/40 portfolio / TF system. In this case, the realised Bear-Sharpe ratio is close to zero, while the total Sharpe ratio is about 0.9, which is almost double the Sharpe ratios of its components. As we see in Figure 3, the TSMOM system has a Bear-Sharpe ratio attribution of 50% smaller than that of European and American TFs. Thus, the Bear-Sharpe ratio emphasises the diversification efficiency for long-only portfolios.

      We note that, because implementation of a TF system requires only a limited capital for margin requirements of trading futures, a TF system can implemented as an overlay to 100% exposure to a long-only portfolio. If we take the 50%/50% blend (which is not far from the optimal blend 40%/60% in Figure 4 and leverage it twice, we obtain the portfolio with 100% exposure to the 60/40 portfolio and 100% exposure to a TF system. We note that recent advances in portfolio products termed “stacking alphas” or “portable alphas”  (see Gordillo-Hoffstein, 2024, Return Stacking: Strategies For Overcoming A Low Return Environment) are based on the same concept of blending a fixed 100% exposure to a long-only portfolio and 100% (or similar) exposure to a TF system or a general managed futures program.

      Further Applications

      Our results, allow for prediction of the performance of TF systems conditional on certain dynamics, such as ARFIMA process. This could be applied for instrument selection and signal/weights adjustments.

      Given that we also derive a very good approximate formulas for the expected turnover of European TF system, our results can be applied for quick optimisations of TF systems.

      Finally, our “Smart Diversification” based on regime-conditional Sharpe ratios enables for design of overlays using TF systems for long-only portfolios. In particular, we show that the optimal weight, according to our “Smart Diversification”, of TF system for 60/40 portfolio is 50%. Return stacked portfolios are obtained by 2x leverage of 50%/50% blend of 60/40 portfolio / TF system.

      Links

      Our paper is available on SSRN: https://papers.ssrn.com/sol3/papers.cfm?abstract_id=3167787

      I presented our paper at CQF Volatility and Risk conference with slides available here and Youtube video of my presentation is available here

      Disclosure

      This research is a personal opinion and it does not represent an official view of my current and last employers.

      This paper and the post is an investment advice in any possible form.

      Share this:

      • Click to share on LinkedIn (Opens in new window) LinkedIn
      • Click to share on X (Opens in new window) X
      • Click to share on WhatsApp (Opens in new window) WhatsApp
      • Click to email a link to a friend (Opens in new window) Email
      • Click to print (Opens in new window) Print
      Posted in Asset Allocation, Quantitative Strategies, Trend-following, Uncategorized | 1 Comment
    • Optimal allocation to cryptocurrencies in diversified portfolios – update on research paper

      Posted at 3:08 pm by artursepp, on August 18, 2024

      Cryptocurrencies have been acknowledged as an emerging asset class with a relatively low correlation to traditional asset classes and independent drivers of their long-term performance (see for an example excellent papers by Harvey et al (2022) and Adams at al (2024)).

      A year ago in Summer of 2023, I published research article in Risk Magazine (SSRN draft) on quantitative methods for optimal allocation to cryptocurrencies within alternative and balanced portfolios. The metrics for consideration include metrics for portfolio diversification, expected risk-return relationships and skewness of the returns distribution. Using roll-forward historical simulations, I showed that all four allocation methods produce a persistent positive allocation to Bitcoin and Ether in alternative and balanced portfolios with a median allocation of about 2.7%.

      This time, I would like to present the updated outcomes from my model given that Bitcoin and Ether had a strong performance of 95% and 35%, respectively, since the last update to today (from 30Jun2023 to 16Aug2024).

      Spoiler: the performance of all four methods for balanced and alts portfolios have been in line with what has been reported in the article with optimal allocation weights to Bitcoin and Ether largely unchanged. Python code for this analysis is available in OptimalPortfolios packadge github repo.

      First I start with the analysis of annual rolling performance. In Subplot (A) of Figure 1, I  show Sharpe ratios (through the paper and this post, the Sharpe ratio is computed using monthly log-returns adjusted by 3m UST rate) for trailing holding periods with the period start given in the first column and the period end given in the first row. For an example, Sharpe ratio realized from the investment period from 31Dec2020 to 16Aug2024 is 0.29.

      Clearly, the early periods before 2017 are characterized with higher realized Sharpe ratios. What is remarkable that any investment period that starts at the end of each calendar year from 2010 to today generated positive Sharpe ratio. In Subplot (B) of Figure 1, I  show the realised skeweness of monthly returns. In early periods, the monthly performance exhibits highly positive skewness. Also more recently the skeweness became positive again.

      Figure1. Realized Sharpe ratios from the period start (given in the first column) to the period end (given in the first row). Subplot (A) shows Sharpe ratio using average monthly log-returns; Subplot (B) shows skewness of monthly returns.

      Methodology

      The long-term positive performance and positive skeweness of cryptocurrency returns pose well for quantitative allocation methods.

      In the paper I consider four quantitative allocation methods for construction of optimal portfolios:
      1) Two risk-based methods which include portfolios constructed using equal risk contribution and with maximum diversification methods.
      2) Two risk-return based methods which include portfolios constructed using maximum Sharpe ratio and maximum CARA-utility methods.

      For the investment universe, I consider the two mandates:

      1) Alternatives (Alts) or unconstrained mandate that targets absolute returns by investing into alternative assets. This mandate is typical for high net worth private investors and family offices.

      2) Benchmarked (Balanced) mandate which targets excess returns over a benchmark by allocating to a balanced equity/bond portfolio with additional overlay to alternative assets. Such a mandate is typical for institutional investors such as pension funds, insurance companies, and endowments.

      As the balanced benchmark, I use the classic 60/40 equity/bond portfolio. I fix the target weight of the balanced portfolio for this mandate to 75% and assign $25%$ allocation to alternative assets. As a result, I consider the modern 70%/30%$approach for allocation portfolio of institutional mandates (see, for an example, McVey et al (2022)) with 30% allocation to bonds, 45% to public equities and 25% to alternative assets.

      I refer to the paper for the investment universe of this mandates (In this analysis I change the benchmark for macro funds from NEIXMTI Index to HFRIMDT Index). For each allocation method, I evaluate the following portfolios given in Table 1 below. Portfolios 1, 2, 3 provide insights into the marginal contribution of including cryptocurrencies to investable universe alternative portfolios. Portfolios 4, 5 and 6 provide with insights into including cryptocurrencies to alternatives for blending with the 60/40 equity/bond portfolio. The marginal contribution of including cryptocurrencies is estimated using 4 portfolios with either BTC or ETH using 4 allocation methods, with total of 16 different portfolio schemes allocated to cryptocurrencies. I sue spot returns for performances of cryptocurrencies. This provides a sufficient depth for making insights.

      Table 1. Simulated mandate portfolios with cryptocurrencies.

      Optimal Portfolios and Their Performances

      I use quarterly rebalancing and roll-forward analysis for generation and backtest of optimal portfolios. I describe the methodology in the paper  and in github package

      Here, I present the result of roll forward simulations from 31Mar2016 t0 16Aug2024. I will present some key figures here, all outputs can be found in pdf report of backtests.

      Maximum Diversification

      Maximum Diversification is my favorite method because it takes into account only the covariance matrix. Also, unlike Equal Risk Contribution method, Maximum Diversification method may produce zero weights to unattractive instruments. In Table 3, I show the risk-adjusted performance of the simulated portfolios without crypto and with inclusion of BTC and ETH cryptocurrencies. The Sharpe ratio is computed using monthly log-returns adjusted by 3m UST rate, beta and (annualised) alpha are computed by regression of monthly returns against 60%/40% equity/bond (Balanced) portfolio.

      The marginal gain of including BTC and ETH is of +0.24 (=0.70-0.46) and +0.29 (=0.75-0.46) in Sharpe ratio for Alternative portfolios and of +0.23 and +0.21 for Balanced portfolios, which is significant.

      In the last 4 rows I show the weight allocated to cryptocurrencies. The median allocation weight is 2.2%/1.9% and 3.13%/3.04% for BTC or ETH in alternatives and balanced portfolios, respectively.

      Table 3. Risk-adjusted performance of Maximum Diversification allocation method.

      In Figure 2, I show the time series of cumulative performances and drawdowns of Maximum Diversification portfolios. Adding cryptocurrencies to the portfolio universe did not materially impact realised drawdowns.

      Figure2. Cumulative performance of portfolios computed using Maximum Diversification allocation method.

      In Figure 3, I show the stack plot of optimal weights for BTC for alternatives and balanced mandates. We observe that the optimal weight of BTC has been persistent through the backtest period, in contract to other asset classes. It is interesting, that the optimal allocation to alternatives within balanced portfolio includes only Bitcoin and SG Trend instruments for the past two years.

      Figure 3. Optimal Allocation weights for alternative and balanced mandates with universe including BTC.

      Equal Risk Contribution

      Equal risk contribution allocates equal buckets for risk (for Balanced mandate, 75% of risk is assigned to the balanced portfolio). We observe that adding cryptocurrencies improves the risk-adjusted performance of alternatives mandate. Interestingly, from the standpoint of the equal risk contribution method, allocations to BTC and ETH are almost same.

      Table 3. Risk-adjusted performance of Equal Risk Contribution allocation method.

      Maximum Sharpe Ratio

      I use the rolling window of 5 years to estimate asset return and covariances for the estimation of the Sharpe ratio. For alternatives portfolio, the contribution to the performance (+0.80 and +0.67 in Sharpe) from adding cryptocurrencies is significant with their median weights of 9% and 4% for BTC and ETH. It is clear that using past returns as inputs to the optimiser may not be robust, however increasing the universe may lead to better results because of higher degree of freedom.

      Table 4. Risk-adjusted performance of Maximum Sharpe Ratio allocation method.

      Carra Mixture Utility

      To estimate the 3-state mixture of returns distribution for the Carra Mixture utility, I also use the rolling window of 5 years. As I explain in the paper, the Carra Mixture Utility allocation method favors instruments with positive skeweness. Similarly to the Maximum Sharpe ratio, adding cryptocurrencies to the alternatives portfolio improves the realised Sharpe ratio considerably by +0.84 and +0.64 with BTC and ETH, respectively. The median allocated weight is 21% and 8% for alternatives mandate and 19% and 8% for the balanced mandate. The higher weights are the result of overweighting instruments with positive skeweness.

      Table 5. Risk-adjusted performance of Carra Mixture Utility allocation method.

      Summary of Weights

      In the summary, I would like to the review the optimal weight to cryptocurrencies. The major goal of my article is to show that cryptocurrencies deserve an allocation for broad portfolios. In my analysis, I did not impose any allocation constraints to make a fair argument.

      In Figure 4 I show the time series of optimal allocations to BTC and ETH by each method and for each mandate. In Table 6, I show summary of weights aggregated from time series.

      Carra Mixture (CARRA-3) allocation method assigns the highest allocation to cryptocurrencies because it favors assets with high positive skewness.

      We observe that the Maximum Sharpe ratio and Carra Mixture, which take into account the rolling performance of assets, have been producing smaller allocation weights in recent years following smaller the risk-adjusted performances of cryptocurrencies.

      However, the risk based methods including Equal Risk Contribution (ERC) and Maximum Diversification (MaxDiv) produce largely stable allocation to cryptocurrencies, which stay largely intact in past couple of years.

      The median of the time series median allocation is 5.7%, 3.8%, 3.0%, 2.4%, which gives a “median”allocation of 3.4% which slightly increased from 2.7% which I reported originally in the paper.

      Figure 4. Optimal weights to BTC and ETH by allocation methods.

      Table 6. Summary of weights

      Further reading

      Enjoy reading the paper and experiment with Python code

      Disclosure

      This research is a personal opinion and it does not represent an official view of my current and last employers.

      This paper and the post is an investment advice in any possible form.

      Cryptocurrencies are associated with high risk.

      Share this:

      • Click to share on LinkedIn (Opens in new window) LinkedIn
      • Click to share on X (Opens in new window) X
      • Click to share on WhatsApp (Opens in new window) WhatsApp
      • Click to email a link to a friend (Opens in new window) Email
      • Click to print (Opens in new window) Print
      Posted in Asset Allocation, Crypto, Decentralized Finance, Python, Quantitative Strategies, Uncategorized | 2 Comments
    • Optimal Allocation to Cryptocurrencies in Diversified Portfolios – research paper

      Posted at 1:43 pm by artursepp, on September 13, 2022

      Cryptocurrencies have been acknowledged as an emerging asset class with a relatively low correlation to traditional asset classes. One of the most important questions for allocators is how much to allocate to Bitcoin and to a portfolios cryptocurrency assets within a broad portfolio which includes equities, bonds, and other alternatives. I wrote a research paper addressing this questions. I will provide a short summary here and refer to my paper on SSRN for details.

      I apply four quantitative methods for optimal allocation to Bitcoin cryptocurrency within alternative and balanced portfolios based on metrics of portfolio diversification, expected risk-returns, and skewness of returns distribution. Using roll-forward historical simulations, I show that all four allocation methods produce a persistent positive allocation to Bitcoin in alternative and balanced portfolios. I find that the median of optimisers’ average weights is 2.3% and 4.8% for 100% alternatives and for 75%/25% balanced/alternatives portfolios, respectively. I conclude that Bitcoin may provide positive marginal contribution to risk-adjusted performances of optimal portfolios. I emphasize the diversification benefits of cryptocurrencies as an asset class within broad risk-managed portfolios with systematic re-balancing.

      I start by considering a few drivers that support the allocation to Bitcoin using on statistical properties of its returns (see Harvey et al (2022) for an excellent review of supporting fundamental factors).

      Rolling Performance of Bitcoin returns

      Stellar performances of core cryptocurrencies, including Bitcoin and Ethereum, have been a major supporting factor for investing into cryptocurrencies. However, these performances are realized with high volatilities, so that risk-adjusted performance, for example measured by Sharpe ratio of average log-returns, is not very significant and have been declining over the past years.

      In Subplot (A) of Figure (1) I show Sharpe ratios for trailing holding periods with the period start given in the first column and the period end given in the first row. For an example, Sharpe ratio corresponding to the period from 31 December 2017 to 1 September 2022 is 0.10. It is obvious that most of large gains are attributed to periods prior to the end of 2017, when Bitcoin was little known to investment community. As a result, any historical analysis covering the early years of Bitcoin performance should be taken with caution.

      Figure (1). Realized performance from the period start (given in the first column) to the period end (given in the first row). Subplot (A) shows Sharpe ratio using average monthly log-returns; Subplot (B) shows skewness of monthly returns

      Correlations

      A low correlation with traditional asset classes has been a supporting factor for allocating to cryptocurrencies within broad portfolios. In Figure (2) I show correlation matrices of monthly returns for three different periods: prior to 2018, from 2018 to August 2022, and from 2020 to August 2022. We see that returns of Bitcoin were little correlated to 60/40 portfolio in the early period, however, the correlation between Bitcoin and equities and bonds increased over the past three years. Remarkably, Bitcoin’s correlation with returns on alternative assets has not changed significantly. Thus, the allocation to Bitcoin is still viable within a diversified portfolio of alternatives.

      Figure (2). Correlation matrix of monthly log-returns between assets in the investable universe for three periods. HFs is HFRX Global Hedge Fund Index, SG Macro is SG Macro Trading Index, SG CTA is SG CTA Index, Gold is SPDR Gold ETF (NYSE ticker GLD).

      Positive skewness of distribution of Bitcoin returns

      Positive skewness of returns of cryptocurrencies is a supporting factor for allocation to this asset class. Indeed, in a very interesting paper, Ang et al (2022) argue that for skewness-seeking investors the allocation to Bitcoin could be optimal even if cross-sectional mean return may be negative. However, we observe that the realized skewness of returns of Bitcoin has been declining, following the decline of its Sharpe ratio, as I show in Subplot (B) of Figure (1). While in early years Bitcoin returns are characterized by high positive skewness, the skewness became negative in recent years. Still, the realized skewness of Bitcoin returns is higher than that of traditional assets. Importantly, Ang et al (2022) apply a two-state Normal mixture model to describe the profile of returns on Bitcoin. Further they apply maximization of CARA utility for skewness-seeking investors using this mixture model. I extend the model of Ang et al to multi-asset universe with N assets including Bitcoin.

      I apply Gaussian Mixture model with M clusters to describe the distribution of asset returns conditional on a few clusters. Within each cluster, the distribution of N-dimensional vector of asset returns is normal with vector of estimated means and covariance matrix. I employ Python module sklearn.mixture for the estimation of Gaussian Mixture model and, through cross-validation, I have concluded that using 3 clusters is most robust to model the distribution of monthly returns of assets in our universe. In Figure below, I show the scatterplot of Bitcoin returns vs returns of 60/40 benchmark portfolio and one-std ellipsoids of Gaussian distribution in estimated clusters for two periods.

      Figure (3). Scatter plot and model clusters using estimated Gaussian mixture model. Subplots (A) and (B) show returns data from 19 July 2010 and from 18 December 2017, respectively, to 31 August 2022. Subplots (C) and (D) show corresponding cluster parameters for Bitcoin.

      Portfolio Allocation Methods

      I consider four quantitative asset allocation methods for construction of optimal portfolios.

      Risk-only based methods which include portfolios with equal risk contribution (denoted by ERC) and with maximum diversification (MaxDiv).

      Risk-return based methods which include portfolios with maximum Sharpe ratio (MaxSharpe and with maximum CARA-utility.

      For each allocation method, I evaluate the following portfolios:

      1. 100% Alts w/o BTC is the portfolio including alternative assets excluding Bitcoin;
      2. 100% Alts with BTC is the portfolio including alternative assets and Bitcoin;
      3. 75%/25% Bal/Alts w/o BTC is the portfolio with fixed allocation to 75% of balanced 60/40 equity/bond portfolio and 25% allocation to alternative assets excluding Bitcoin;
      4. 75%/25% Bal/Alts With BTC is the portfolio with fixed allocation to 75% of balanced 60/40 equity/bond portfolio and 25% allocation to alternative asset classes including Bitcoin.

      Portfolios 1 and 2 enable us to analyze the marginal contribution of including Bitcoin to the investable universe of alternative portfolios. Portfolios 2 and 3 provide with insights into including Bitcoin to alternatives universe for constructing overlays for 60/40 equity/bond portfolio.

      Optimal weights

      In table below, I show the statistics of time series of optimal weights to Bitcoin produced by the four implemented portfolio optimisers. First, it is notable that all four optimizers produced non-zero weights at all quarterly re-balancing (because the time series minimum is higher than zero) for both portfolios, except for the last quarterly rebalancing of the most diversified 75%/25% portfolio. The optimization of CARA utility produced the highest allocation to Bitcoin for both portfolios, because Bitcoin adds most to the skewness of portfolio returns that is favorable for CARA method. However, the CARA portfolios have the lowest historical allocation to Bitcoin because of declining skewness of its returns. The median of optimisers’ average weights is 2.3% and 4.8% for 100% alts and 75%/25% alts/balanced portfolios, respectively. As a result, including of Bitcoin to the investable universe is beneficial for diversification benefits of broad portfolios.

      Figure (4). Minimum, average, maximum, and last weight (as of last quarterly re-balancing on 30 June 2022) to Bitcoin by allocation methods computed using roll-forward simulations from 30 June 2015 to 31 August 2022. Subplot (A) shows the weight in the 100% alternatives portfolio, Subplot (B) shows the weight in the 75%/25% balanced and alts portfolio. ERC is portfolio with equal risk contribution, MaxDiv is portfolio with maximum diversification, MaxSharpe is portfolio with maximum Sharpe ratio, CARA-3 is portfolio with maximum CARA utility under Gaussian mixture model with 3 clusters.

      Trailing performance

      In below table I show trailing realized Sharpe ratios of simulated optimal portfolios. I add equally weighted portfolio as a benchmark. For 100% alts portfolio w/o and with Bitcoin, the weight of Bitcoin is fixed to 0% and 2%, respectively, while the rest is equally allocated to alternative assets. For 75%/25% balanced/alts portfolio w/o and with Bitcoin, the weight of Bitcoin is fixed to 0% and 0.5%, respectively, the weight of 60/40 portfolio is 75% and rest is equally allocated to alternatives.

      First, comparing 100\% alts portfolio w/o and with Bitcoin, we see that adding Bitcoin to the investable universe increased Sharpe ratios over the past periods of 2, 3, 5, 7 years except for the portfolio with maximum Sharpe ratio. The performance over the last year is better for portfolios without Bitcoin. However, I emphasize a robust positive performance of risk-based portfolios with and without Bitcoin in comparison to a poor performance of the benchmark balanced portfolio.

      Contrasting 75%/25% balanced/alts portfolio w/o and with Bitcoin, we see that including Bitcoin benefits most of portfolios over all trailing periods. The exceptions include, first, the portfolio with the maximum Sharpe ratio and, second, for the ERC portfolio which slightly under-performs when Bitcoin is added.

      A poor relative performance of portfolios with maximum Sharpe ratio highlights the hazard of relying on past data for forecast of future returns. In contrast, out-performers include risk-based methods that rely on the dynamic update of covariance matrices using most recent data.

      Figure (5) Sharpe ratios for trailing periods of 1, 2, 3, 5, 7 years starting from 31 August 2021, 2020, 2019, 2017, 2016, respectively, up to 31 August 2022. 60/40 is the benchmark equity/bond balanced portfolio, and EqualWeight w/o and with BTC are equally weighted portfolios with fixed 0% and 2% weights to Bitcoin, respectively.

      Conclusion

      I present empirical evidence that it has been optimal to include Bitcoin to an investable universe for alternative and blended portfolios, using portfolio diversification metrics. Using roll-forward analysis with dynamic updates of portfolio inputs, I also find that adding Bitcoin have improved performances of optimal portfolios.

      I conclude that adding Bitcoin, and more generally, a diversified basket of cryptocurrencies, to the investable universe of broad portfolios may be beneficial for both alternative portfolios and blended balanced/alternative portfolios. I emphasize the need for a robust portfolio allocation method with regular updates of portfolio inputs and re-balancing of portfolio weights.

      My favorite allocation method is the optimiser of portfolio diversification metric along with the optimiser of the CARA utility under Gaussian mixture distribution for skewness-seeking investors.

      Further details are provided in my paper on SSRN http://ssrn.com/abstract=4217841

      Disclaimer

      The views and opinions presented in this article and post are mine alone. This research is not an investment advice.

      Share this:

      • Click to share on LinkedIn (Opens in new window) LinkedIn
      • Click to share on X (Opens in new window) X
      • Click to share on WhatsApp (Opens in new window) WhatsApp
      • Click to email a link to a friend (Opens in new window) Email
      • Click to print (Opens in new window) Print
      Posted in Asset Allocation, Crypto, Decentralized Finance, Quantitative Strategies | 2 Comments
    • Developing systematic smart beta strategies for crypto assets – QuantMinds Presentation

      Posted at 3:09 pm by artursepp, on February 23, 2022

      I am delighted to share the video from my QuantMinds presentation that I made in Barcelona in December 2021. Many thanks to QuantMinds organizers for allowing me to share this video. First, it was nice to attend the onsite conference in a while and to meet old friends and colleagues. I was positively surprised by how many people attended. Many thanks to organizers for making it happen during these uncertain times!

      I presented a framework for the design of sector-based smart beta indices and products for diversified investing to crypto assets. There are thee challenges to account for when designing a systematic strategy on crypto assets.

      First, the data quality is poor indeed. We need to tackle the enormous challenge to accommodate and filter data from multiple data providers. Unlike the traditional asset classes, the market data for public data (such as market cap and traded volumes) can be a source of alpha for systematic strategies.

      Second, the time history of data is very short. For example, most of protocol tokens for Decentralized Finance (DeFi) applications were listed during the second half of 2020, which means that we have to ascertain the design and risk-reward profile of a strategy using one year of data.

      Third, the liquidity of crypto assets may be insufficient when contrasted with traditional assets. Therefore, we need to carefully design strategies by screening and incorporating the liquidity into the process. One of the challenges is that most crypto exchanges (there are about 30 tier one exchanges) tend to over-estimate their traded volumes.

      To overcome these challenges, I constructed a bootstrapping simulation engine which allows to generate joint paths of price and fundamental data for the empirical distributions without breaking the correlation and auto-correlation structure of dependencies in the data.


      Share this:

      • Click to share on LinkedIn (Opens in new window) LinkedIn
      • Click to share on X (Opens in new window) X
      • Click to share on WhatsApp (Opens in new window) WhatsApp
      • Click to email a link to a friend (Opens in new window) Email
      • Click to print (Opens in new window) Print
      Posted in Asset Allocation, Crypto, Decentralized Finance, Quantitative Strategies | 2 Comments
    • Tail risk of systematic investment strategies and risk-premia alpha

      Posted at 2:55 pm by artursepp, on April 9, 2019

      Everyone knows that the risk profile of systematic strategies can change considerably when equity markets turn down and volatilities spike. For an example, a smooth profile of a short volatility delta-hedged strategy in normal regimes becomes highly volatile and correlated to equity markets in stressed regimes.

      Is there a way to systematically measure the tail risk of investment products including hedge funds and alternative risk premia strategies? Further, how do we measure the risk-premia compensation after attribution for tail risks? Finally, would we discover patterns in cross-sectional analysis of different hedge fund strategies?

      I have been working through years on a quantitative framework to analyse the above raised questions and recently I wrote two articles on the topic:

      1. The regime-conditional regression model is introduced in The Hedge Fund Journal (online paper).
      2. A short review of the methodology and results is presented for QuantMinds

      I would like to highlight the key results of the methodology so that interested readers can further follow-up with the original sources.

      Regime conditional index betas

      In the top Figure, I show the regime conditional betas for a selection of hedge fund style from HFR indices data using the S&P 500 index as the equity benchmark.

      We can classify the strategies into defensive and risk-seeking based on their return profile in bear market regimes:

      1. Defensive strategies (long volatility, short bias, trend-following CTAs) have negative equity betas in bear regime so that these strategies serve as diversifiers of the equity downside risk.
      2. Risk-seeking strategies (short volatility, risk-parity) have positive and significant equity betas in bear regime. Equity betas of most of risk-seeking strategies are relatively small in normal and bull periods but equity betas increase significantly in bear regimes. I term these strategies as Risk-seeking risk-premia strategies.
      3. I term strategies with insignificant betas in normal bear regimes as Diversifying strategies. Examples include equity market neutral and discretionary macro strategies because, even though these strategies have positive betas to the downside, the beta profile does not change significantly between normal and bear regimes. As a result, the marginal increase in beta exposure between normal and bear periods is insignificant.

      Risk-premia alpha vs marginal bear beta

      I define the risk-premia alpha as the intercept of the regime-conditional regression model for strategy returns regressed by returns on the benchmark index. To show a strong relationship between the risk-premia alpha and marginal bear beta (the marginal bear betas are computed as the difference between betas in normal and bear regimes), I apply the cross-sectional analysis of risk premia for the following sample of hedge fund indices and alternative risk premia (ARP) products, using quarterly returns from 2000 to 2018 against the S&P 500 total return index:

      1. HF: Hedge fund indices from major index providers including HFR, SG, BarclayHedge, Eurekahedge with the total of 73 composite hedge fund indices excluding CTA indices;
      2. CTA: 7 CTA indices from the above providers and 15 CTA funds specialized on the trend-following;
      3. Vol: 28 CBOE benchmark indices for option and volatility based strategies;
      4. ARP: ARP indices using HFR Bank Systematic Risk-premia Indices with a total of 38 indices.

      In figure below, I plot risk-premia alphas against marginal bear betas grouped by strategy styles. For defensive strategies, their marginal bear betas are negative; for risk-seeking strategies, the marginal bear betas are positive and statistically significant.

      cross_sectional_rp 20190405-085150

      We see the following interesting conclusions.

      1. For volatility strategies, the cross-sectional regression has the strongest explanatory power of 90%. Because a rational investor should require a higher compensation to take the equity tail risk, we observe such a clear linear relationship between the marginal tail risk and the risk-premia alpha. Defensive volatility strategies that buy downside protection have negative marginal betas at the expense of negative risk-premia alpha.
      2. For alternative risk premia products, the dispersion is higher (most of these indices originate from 2007), yet we still observe the pattern between the defensive short and risk-seeking risk-premia strategies with negative and positive risk-premia alpha, respectively.
      3. For hedge fund indices, the dispersion of their marginal bear beta is smaller. As a result, most hedge funds serve as diversifiers of the equity risk in normal and bear periods; typical hedge fund strategies are not designed to diversify the equity tail risk.
      4. All CTA funds and indices have negative bear betas with insignificant risk-premia alpha. Even though their risk-premia alpha is negative and somewhat proportional to marginal bear beta is proportional, the risk-premia alpha is not statistically significant. In this sense, CTAs represent defensive active strategies. The contributors to slightly negative risk-premia alpha may include transaction costs and management fees.


      References

      Sepp A., Dezeraud L., (2019), “Trend-Following CTAs vs Alternative Risk-Premia: Crisis beta vs risk-premia alpha”, The Hedge Fund Journal, Issue 138, page 20-31, https://thehedgefundjournal.com/trend-following-ctas-vs-alternative-risk-premia/

      Sepp, A. The convexity profile of systematic strategies and diversification benefits of trend-following strategies, QuantMinds, April 2019

      Share this:

      • Click to share on LinkedIn (Opens in new window) LinkedIn
      • Click to share on X (Opens in new window) X
      • Click to share on WhatsApp (Opens in new window) WhatsApp
      • Click to email a link to a friend (Opens in new window) Email
      • Click to print (Opens in new window) Print
      Posted in Asset Allocation, Quantitative Strategies, Trend-following, Uncategorized, Volatility Modeling | 1 Comment
    • Machine Learning for Volatility Trading

      Posted at 6:33 am by artursepp, on May 29, 2018

      Recently I have been working on applying machine learning for volatility forecasting and trading. I presented some of my findings at QuantMinds Conference 2018 which I wanted to share in this post.

      My presentation is available at SSRN with the video of the talk in YouTube.

      Continue reading →

      Share this:

      • Click to share on LinkedIn (Opens in new window) LinkedIn
      • Click to share on X (Opens in new window) X
      • Click to share on WhatsApp (Opens in new window) WhatsApp
      • Click to email a link to a friend (Opens in new window) Email
      • Click to print (Opens in new window) Print
      Posted in Asset Allocation, Quantitative Strategies, Uncategorized, Volatility Modeling, Volatility Trading | 3 Comments
    • Trend-following strategies for tail-risk hedging and alpha generation

      Posted at 11:39 am by artursepp, on April 24, 2018

      Because of the adaptive nature of position sizing, trend-following strategies can generate the positive skewness of their returns, when infrequent large gains compensate overall for frequent small losses. Further, trend-followers can produce the positive convexity of their returns with respect to stock market indices, when large gains are realized during either very bearish or very bullish markets. The positive convexity along with the overall positive performance make trend-following strategies viable diversifiers and alpha generators for both long-only portfolios and alternatives investments.

      I provide a practical analysis of how the skewness and convexity profiles of trend-followers depend on the trend smoothing parameter differentiating between slow-paced and fast-paced trend-followers. I show how the returns measurement frequency affects the realized convexity of the trend-followers. Finally, I discuss an interesting connection between trend-following and stock momentum strategies and illustrate the benefits of allocation to trend-followers within alternatives portfolio.

      Interested readers can download the pdf of my paper on SSRN

      Key takeaway

      1. Risk-profile of quant strategies

      The skewness and the convexity of strategy returns with respect to the benchmark are the key metrics to assess the risk-profile of quant strategies. Strategies with the significant positive skewness and convexity are expected to generate large gains during market stress periods and, as a result, convex strategies can serve as robust diversifiers. Using benchmark Eurekahedge indices on major hedge fund strategies, I show the following.

        • While long volatility hedge funds produce the positive skewness, they do not produce the positive convexity.
        • Tail risk hedge funds can generate significant skewness and convexity, however at the expense of strongly negative overall performance.
        • Trend-following CTAs can produce significant positive convexity similar to the tail risk funds and yet trend-followers can produce positive overall performance delivering alpha over long horizons.
        • On the other spectrum, short volatility funds exibit significant negative convexity in tail events.

      Fig2HFconv

      HFSkew

      Continue reading →

      Share this:

      • Click to share on LinkedIn (Opens in new window) LinkedIn
      • Click to share on X (Opens in new window) X
      • Click to share on WhatsApp (Opens in new window) WhatsApp
      • Click to email a link to a friend (Opens in new window) Email
      • Click to print (Opens in new window) Print
      Posted in Asset Allocation, Quantitative Strategies, Trend-following, Uncategorized | 1 Comment
    • Diversifying Cyclicality Risk of Quantitative Investment Strategies: presentation slides and webinar Q&A

      Posted at 5:21 pm by artursepp, on December 1, 2017

      What is the most significant contributing factor to the performance of a quantitative fund: its signal generators or its risk allocators? Can we still succeed if we have good signal generators but poor risk management? How should we allocate to a portfolio of quantitative strategies?

      I have developed a top-down and bottom-up model for portfolio allocation and risk-management of quantitative strategies. The interested readers can find  the slides of my presentation here  and can watch the webinar can be viewed on youtube.

      Keep on Reading!

      Share this:

      • Click to share on LinkedIn (Opens in new window) LinkedIn
      • Click to share on X (Opens in new window) X
      • Click to share on WhatsApp (Opens in new window) WhatsApp
      • Click to email a link to a friend (Opens in new window) Email
      • Click to print (Opens in new window) Print
      Posted in Asset Allocation, Quantitative Strategies, Trend-following, Uncategorized, Volatility Modeling, Volatility Trading | 1 Comment
    • Allocation to systematic volatility strategies using VIX futures, S&P 500 index puts, and delta-hedged long-short strategies

      Posted at 3:45 pm by artursepp, on September 20, 2017

      I present a few systematic strategies for investing into volatility risk-premia and illustrate their back-tested performance. I apply the four factor Fama-French-Carhart model to attribute monthly returns on volatility strategies to returns on the style factors. I show that all strategies have insignificant exposure to the style factors, while the exposure to the market factor becomes insignificant when strategies are equipped with statistical filtering and delta-hedging. I show that, by allocating 10% of portfolio funds to these strategies within equity and fixed-income benchmarked portfolios, investors can boost the alpha by 1% and increase the Sharpe ratio by 10%-20%.

      Keep on Reading!

      Share this:

      • Click to share on LinkedIn (Opens in new window) LinkedIn
      • Click to share on X (Opens in new window) X
      • Click to share on WhatsApp (Opens in new window) WhatsApp
      • Click to email a link to a friend (Opens in new window) Email
      • Click to print (Opens in new window) Print
      Posted in Asset Allocation, Quantitative Strategies, Uncategorized, Volatility Modeling, Volatility Trading | 4 Comments
    • Quantitative Approaches to Wealth Management: An Interview for Instututional Investor Journals

      Posted at 3:51 pm by artursepp, on June 1, 2017

      The key issues for allocators and investors are the very low and mostly negative interest rates for core government bonds, toppish valuations in stock markets, permanent level of high risk-aversion by individual investors. How do we go from here?

      Well, these are the questions that I am trying to solve in my current role for our client and for myself. In this respect, I was very pleased to be interviewed by Barbara Mack from Institutional Investor Journals to discuss my experience and my thoughts about the quantitative approaches to wealth management.

      What I wanted to emphasize is the growing importance of quantitative tools and, in particular, robo-advisors, in the wealth management space.

      The pdf with the transcript of my interview: Quantitative Approaches to Wealth Management


      Keep on Reading!

      Share this:

      • Click to share on LinkedIn (Opens in new window) LinkedIn
      • Click to share on X (Opens in new window) X
      • Click to share on WhatsApp (Opens in new window) WhatsApp
      • Click to email a link to a friend (Opens in new window) Email
      • Click to print (Opens in new window) Print
      Posted in Asset Allocation, Quantitative Strategies, Uncategorized | 0 Comments
    • Receive notifications of new posts by email

      Join 339 other subscribers
    • Recent Posts

      • The Science and Practice of Trend-following Systems: paper and presentation
      • Lognormal Stochastic Volatility – Youtube Seminar and Slides
      • Optimal allocation to cryptocurrencies in diversified portfolios – update on research paper
      • Unified Approach for Hedging Impermanent Loss of Liquidity Provision – Research paper
      • Log-normal stochastic volatility with quadratic drift – open access publication
      • Stochastic Volatility for Factor Heath-Jarrow-Morton Framework – research paper
      • AD Derivatives podcast on volatility modeling and DeFi
      • What is a robust stochastic volatility model – research paper
      • Robust Log-normal Stochastic Volatility for Interest Rate Dynamics – research paper
      • Optimal Allocation to Cryptocurrencies in Diversified Portfolios – research paper
      • Log-normal Stochastic Volatility Model for Assets with Positive Return-Volatility Correlation – research paper
      • Developing systematic smart beta strategies for crypto assets – QuantMinds Presentation
      • Toward an efficient hybrid method for pricing barrier options on assets with stochastic volatility – research paper
      • Paper on Automated Market Making for DeFi: arbitrage-fee exchange between on-chain and traditional markets
      • Tail risk of systematic investment strategies and risk-premia alpha
      • Trend-Following CTAs vs Alternative Risk-Premia (ARP) products: crisis beta vs risk-premia alpha
      • My talk on Machine Learning in Finance: why Alternative Risk Premia (ARP) products failed
      • Why Python for quantitative trading?
      • Machine Learning for Volatility Trading
      • Trend-following strategies for tail-risk hedging and alpha generation
    • Categories

      • Asset Allocation (10)
      • Crypto (8)
      • Decentralized Finance (5)
      • Python (4)
      • Quantitative Strategies (17)
      • Trend-following (4)
      • Uncategorized (20)
      • Volatility Modeling (18)
      • Volatility Trading (13)


Loading Comments...